 Role based, complete end-to-end security
Ad hoc reporting, ad hoc query tool
Versatile scheduling/archiving
Strong support for Google maps and SVG maps
Robust API for developers
Internationalization feature ready for global deployment
Role based, complete end-to-end security
Ad hoc reporting, ad hoc query tool
Versatile scheduling/archiving
Strong support for Google maps and SVG maps
Robust API for developers
Internationalization feature ready for global deployment
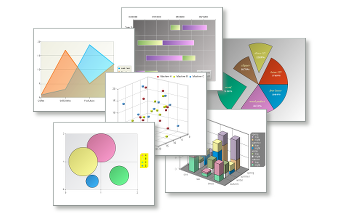 100% pure Java 3D/2D charts
Over 30 chart types, true 3D and statistical charts
Intuitive, yet powerful visual chart designer
Extensive API for easy deployment and run-time customization
Supports drilldown, parameterized charts and trend lines
100% pure Java 3D/2D charts
Over 30 chart types, true 3D and statistical charts
Intuitive, yet powerful visual chart designer
Extensive API for easy deployment and run-time customization
Supports drilldown, parameterized charts and trend lines
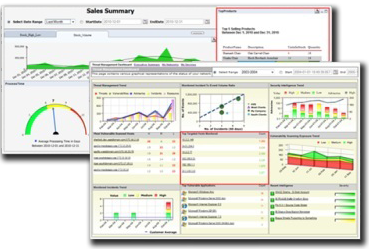
 Monitor KPI's with alert notifications
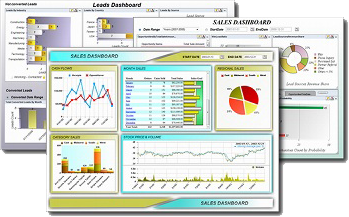
Take control of your organization with dashboard reporting software
Visualize your data and make time critical decisions anytime, anywhere, on-the-go
Monitor KPI's with alert notifications
Take control of your organization with dashboard reporting software
Visualize your data and make time critical decisions anytime, anywhere, on-the-go
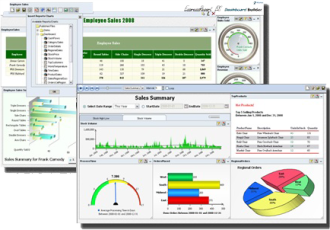
 Actionable, Self-Service Dashboards
Easy to use and powerful dashboard software
No code or script to write
Rapid development, web-based deployment without IT development resource
Actionable, Self-Service Dashboards
Easy to use and powerful dashboard software
No code or script to write
Rapid development, web-based deployment without IT development resource
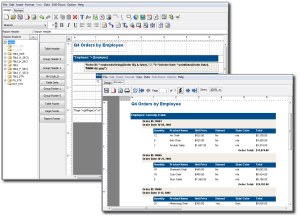 Powerful and easy-to use visual design tool
Robust API that allows easy integration and embedding
Delivers superior performance
Draws data from databases, XML, Excel, text files, SOAP and more
Exports to DHTML, PDF, Excel, RTF, XML, text, or CSV files
Extensive parameter treatment, full-featured charting engine
Powerful and easy-to use visual design tool
Robust API that allows easy integration and embedding
Delivers superior performance
Draws data from databases, XML, Excel, text files, SOAP and more
Exports to DHTML, PDF, Excel, RTF, XML, text, or CSV files
Extensive parameter treatment, full-featured charting engine
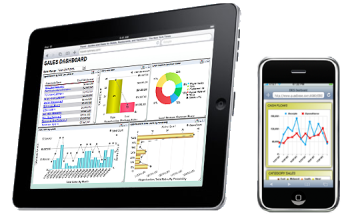 Access your data anywhere, anytime
from your iPad, iPhone,
Android phone or tablet
with our native apps.
Access your data anywhere, anytime
from your iPad, iPhone,
Android phone or tablet
with our native apps.
 Software as a Service: ERES Cloud
Transform your data into actionable information in real-time.
Share insightful reports with your colleagues and customers.
Monitor and analyze business performance with dashboards.
Same great features as in EspressReport ES.
Enterprise performance, security, scalability and SaaS economics.
Software as a Service: ERES Cloud
Transform your data into actionable information in real-time.
Share insightful reports with your colleagues and customers.
Monitor and analyze business performance with dashboards.
Same great features as in EspressReport ES.
Enterprise performance, security, scalability and SaaS economics.
© Quadbase Systems inc. Sitemap
